
Is the sky the limit?
Weather forecasting keeps getting better and better, and a revolutionary AI approach promises even more accurate forecasts. What does the future of forecasting look like?

Confessions of a weather nerd
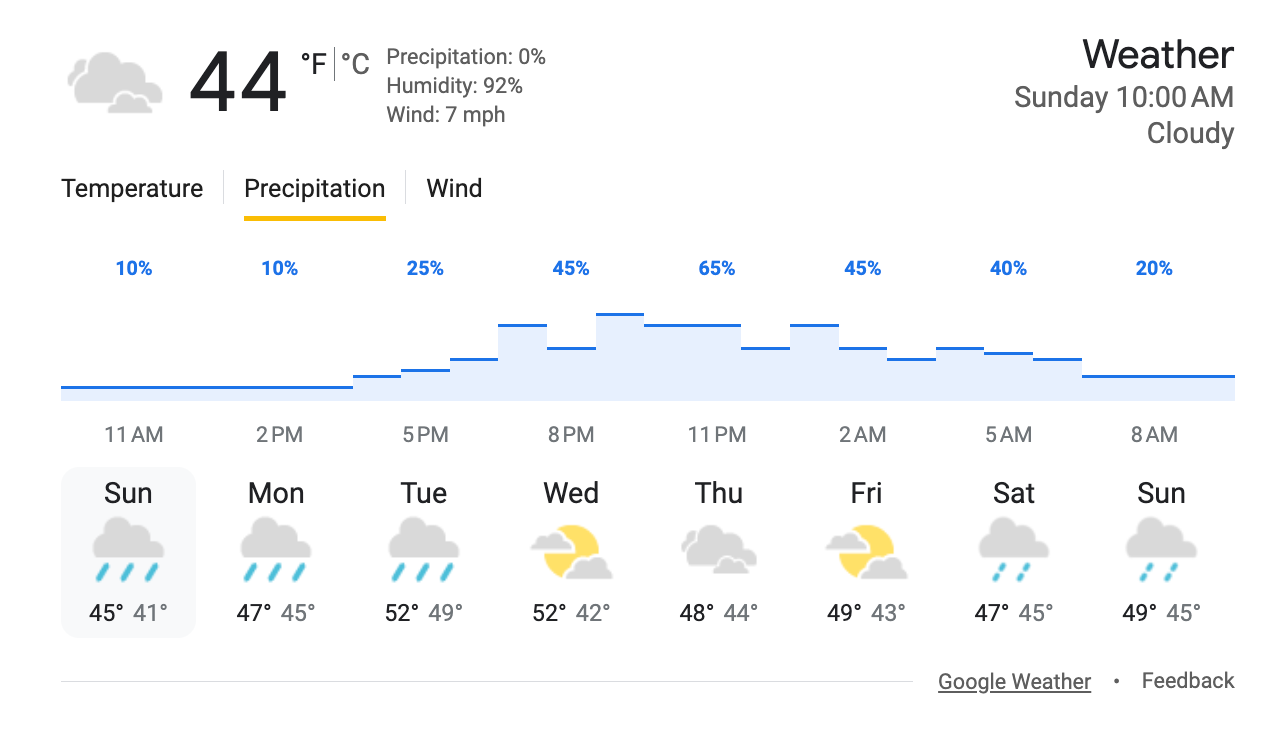
Let's face it: weather forecasts don't always pan out. Here's an example of a busted forecast from a weather app on my phone a few weeks ago.
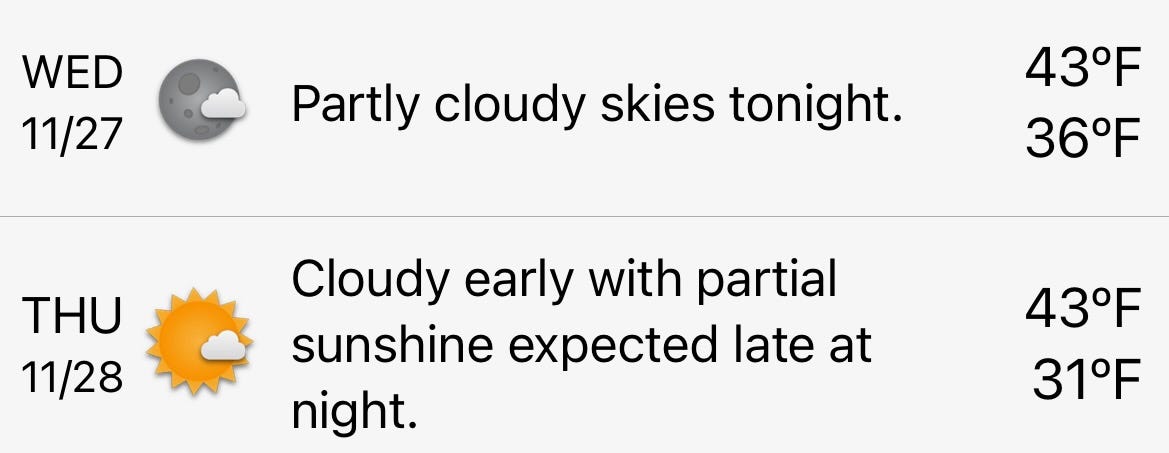
Sadly, there was no sunshine that Thursday night. But that didn't shake my faith in forecasting.
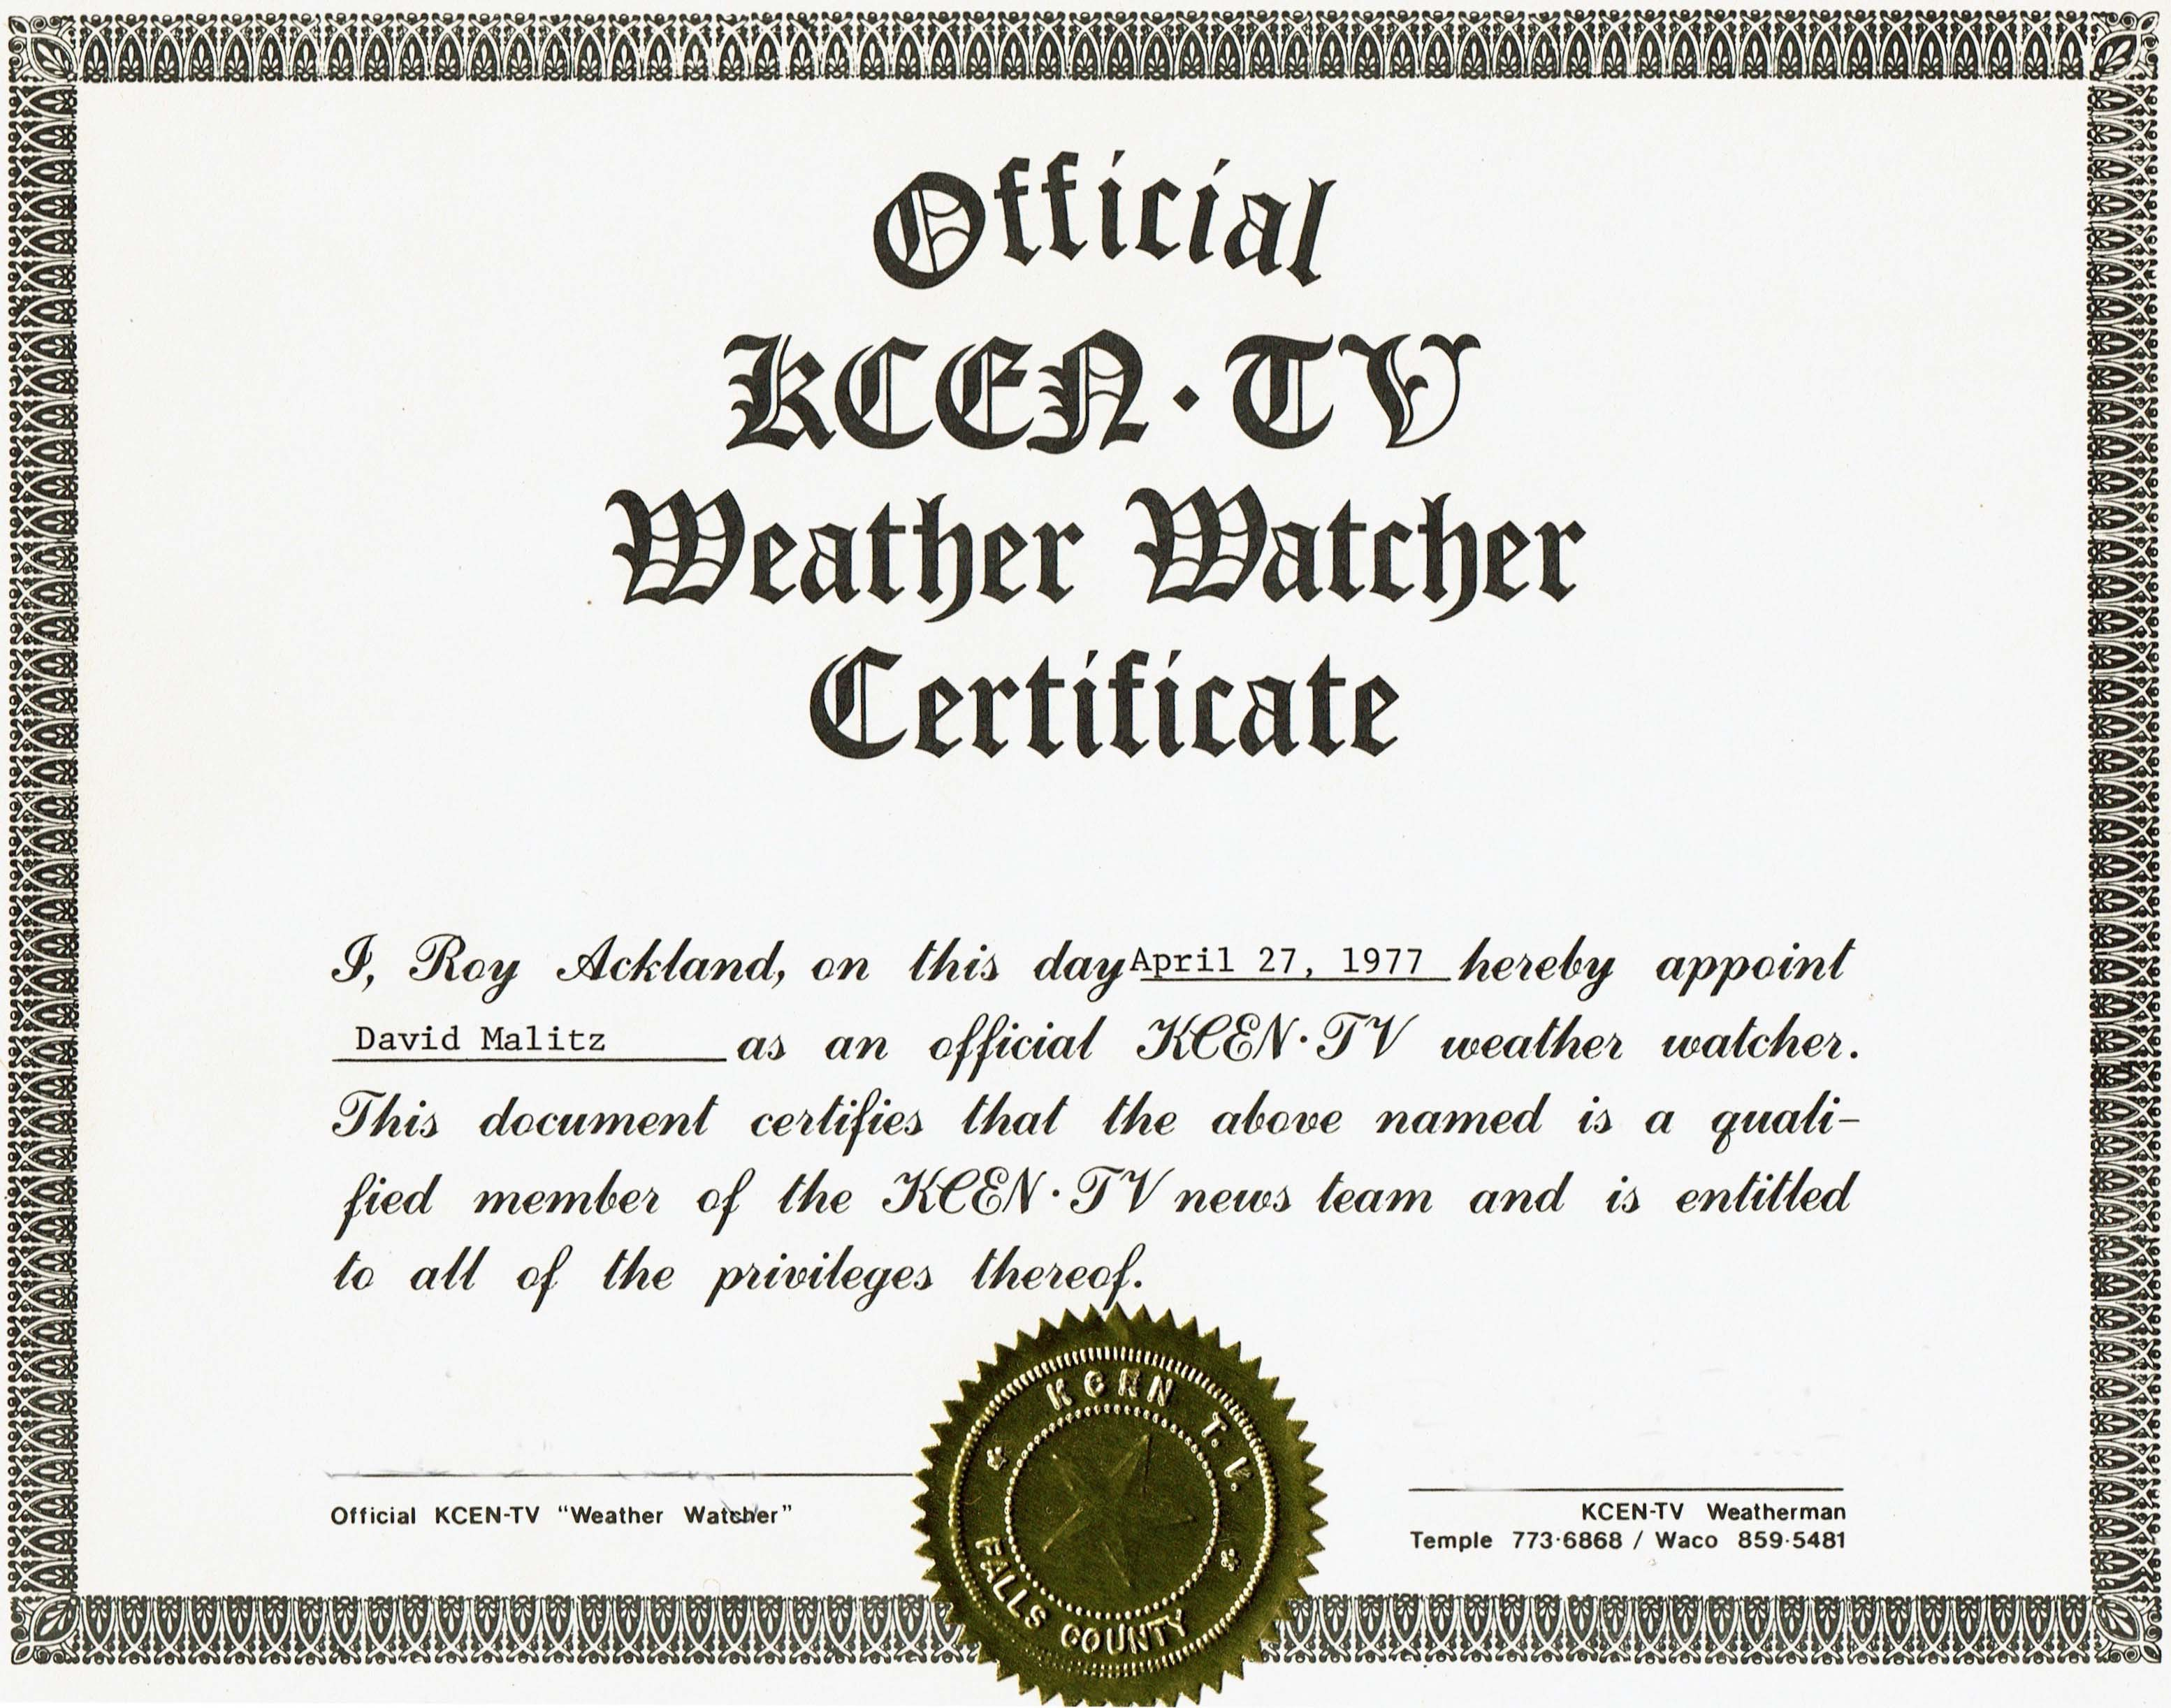
There’s a reason I may be more forgiving than most people. Substantial evidence exists that I am a weather nerd. I have a weather station on the roof of my house. I once worked through an online meteorology course. I regularly read the "scientific weather discussion" posted daily by my local National Weather Service forecast office, though I often struggle to understand it. Back in 1977, I attended a one-hour lecture by a local TV weatherman, earning an official "Weather Watcher Certificate" which deemed me a "qualified member" of the news team, "entitled to all of the privileges thereof" (whatever those might be).
In this weather nerd's opinion, the vast, global machine that churns out the weather forecasts you see on your phone is miraculous, both in its scale and the sophistication of its technology. As you will see, the accuracy of our forecasts has improved steadily and impressively over the past decades. And revolutionary developments using artificial intelligence (AI) are underway which may completely upend the field and make future forecasts startlingly better. Perhaps this essay will nudge you a bit closer to weather nerdiness as well.
A heroic proof of concept
Major forecast centers around the world generate weather predictions using equations that describe the workings of the atmosphere. This is called numeric weather prediction (NWP). For the last part of the 19th century and the first half of the 20th, prior to the invention of computers, meteorologists based forecasts on weather maps that depicted areas of high and low pressure, storm systems, warm and cold fronts, and the like. By comparing the movement of these features between subsequent maps and identifying similar weather patterns in historical records, meteorologists extrapolated future conditions and issued forecasts.
Unfortunately, this compare-and-extrapolate approach was hit-and-miss because weather systems don't maintain constant strength and march steadily from west to east (in the Northern hemisphere). They speed up, slow down curve, and stall. They strengthen, weaken, dissipate, merge and split, and sometimes emerge seemingly out of nowhere. In short, our atmosphere is complex and ever-evolving, making it challenging to simulate. Additionally, these early forecasters were hampered by the extremely sparse observational coverage of the day.
Over 100 years ago, several visionaries explored the use of physics and mathematical models to simulate the atmosphere and forecast conditions. As early as the 1890s, meteorologists recognized that, at least in principle, the equations of physics could be used to model the atmosphere.
In 1904, a Norwegian scientist named Vilhelm Bjerknes identified the exact equations which could be used to model critical meteorological variables. Unfortunately, he couldn't devise a way to solve the equations, causing him to conclude that this approach had no practical use.1
About two decades later, in 1922, an English physicist, Lewis Fry Richardson, completed the first numeric weather prediction (NWP) by solving the equations identified by Bjerknes. It took Richardson six weeks to compute by hand a single six-hour forecast for two locations on a particular day in central Europe.2 His heroic proof-of-concept forecast was wildly inaccurate and took too much time to produce to be useful. But today's algorithms are "remarkably similar" to Richardson's approach, according to meteorologist Peter Lynch who has written extensively about Richardson and the history of weather forecasting.3
That approach is used in models run by the European Center for Medium-Range Weather Forecasts (called ECMWF or the European model), the US National Oceanic and Atmospheric Administration (NOAA), and others. Since its beginnings in the 1950s, "the modern enterprise of weather prediction has been heavily focused on developing faster and better ways of solving the fundamental equations of atmospheric motion and thermodynamics, and on interpreting and applying the results of these calculations.”4
Super-duper computers
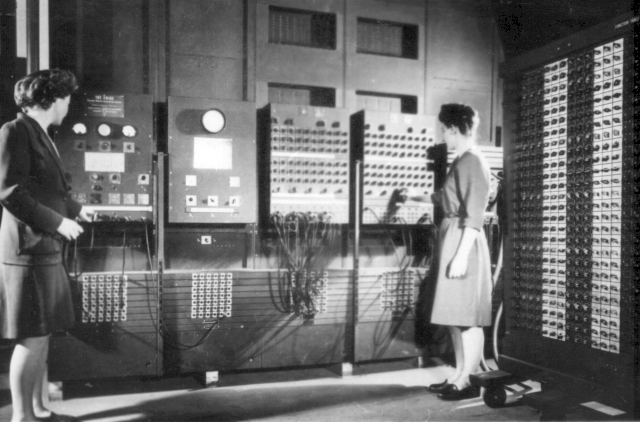
In 1954, computers like the ENIAC pictured below, were developed to handle the number crunching required to make forecasts.
Today's NWP forecasts are churned out by some of the largest, most sophisticated supercomputers on the planet, like this Cray computer operated by the UK's Met Office.
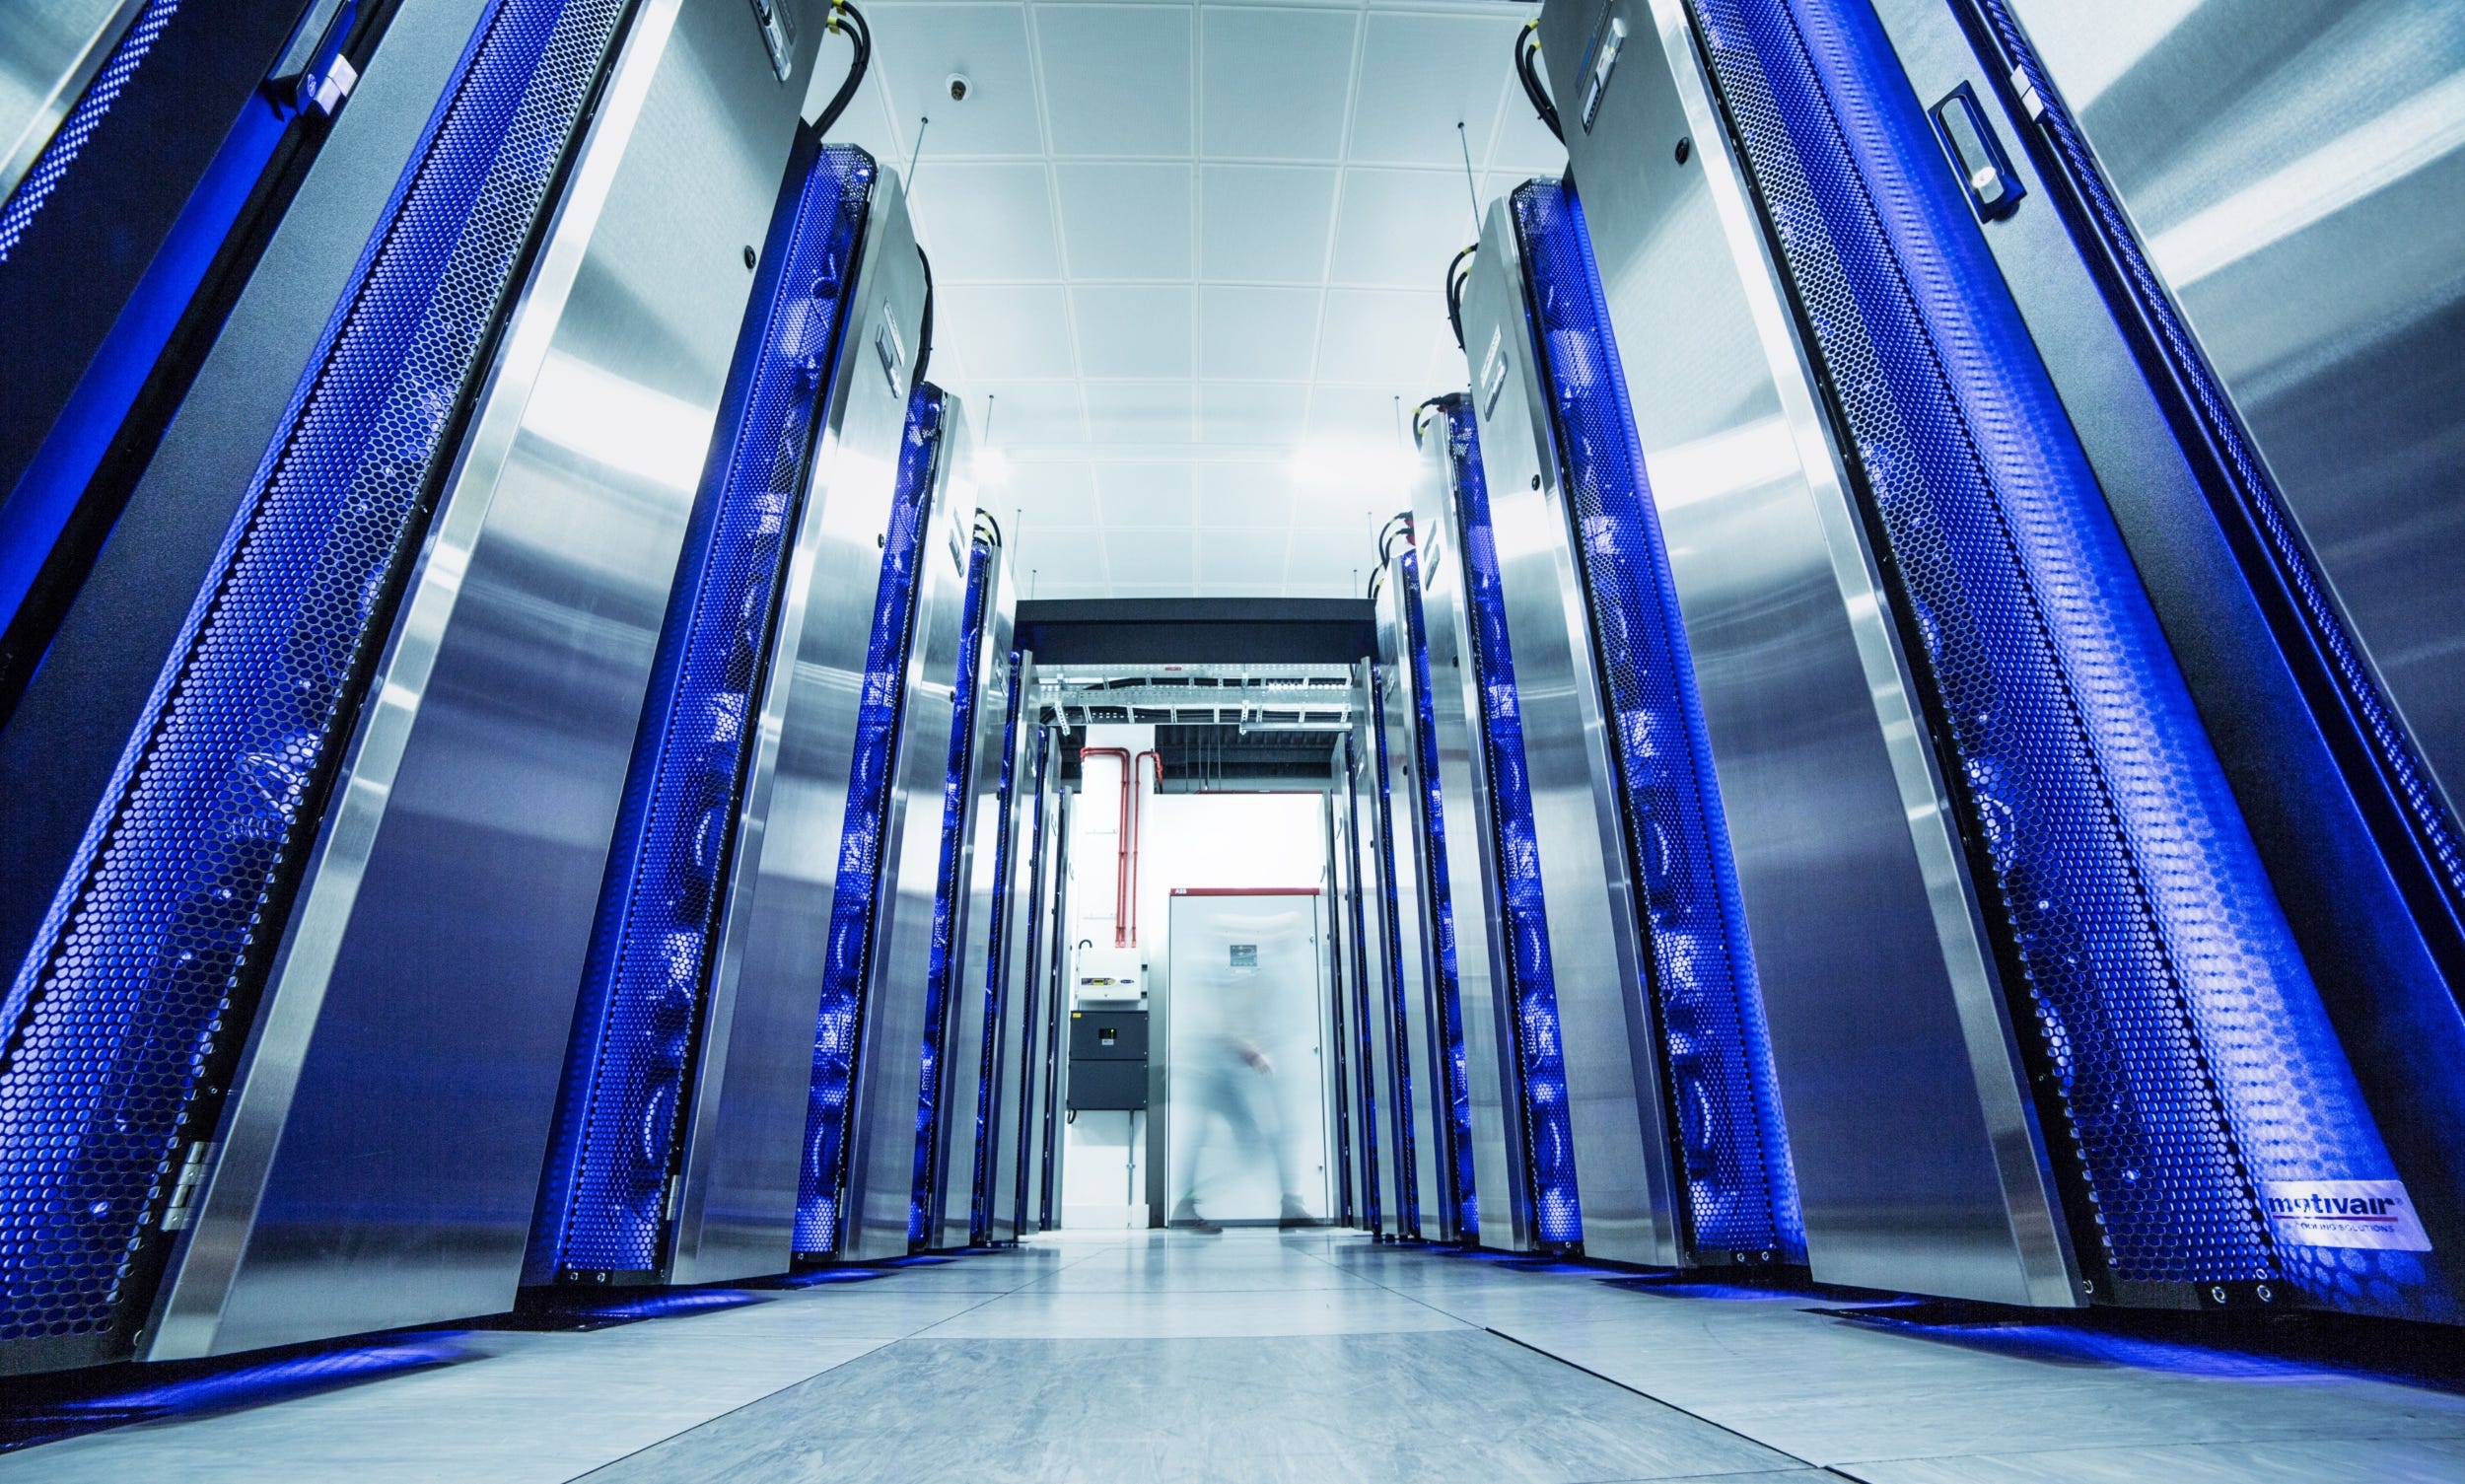
Why are these behemoths needed to run NWP forecasts? To understand this, let's see how weather modeling works.
Weather nerd warning: If you are pressed for time or don’t really care too much how weather models work, feel free to skip ahead to the “Accuracy matters” section, below. I won’t be offended!
Divide and conquer
To generate forecasts, a weather model begins by assimilating current weather observations from around the world. These data are run through atmospheric equations to generate the model’s initial forecast, let’s say for three hours from now. The three-hour forecast is then used as input to produce a six-hour forecast. This process of using one hourly forecast as input for the next hourly forecast is repeated until a final forecast, usually two weeks from the starting point, is completed.
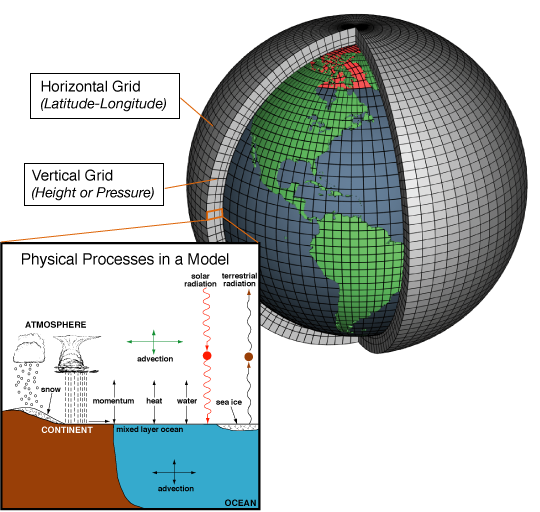
The atmospheric equations aren't applied to the entire planet all at once, but to individual cells which are created by slicing the atmosphere into smaller horizontal and vertical chunks.
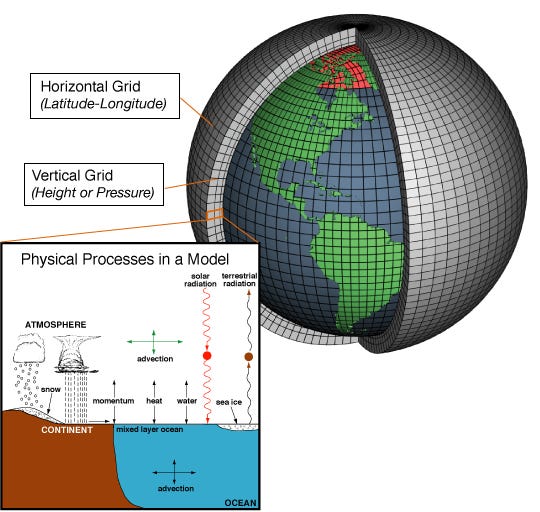
Models differ with regard to their resolution: the number of cells that are defined within the atmosphere. The smaller and more numerous the cells, the higher the model’s resolution and the greater the detail and accuracy of the forecast.
The ECMWF's European models are considered the most accurate in the world. In their highest resolution model, the horizontal distance between grid points is 9 km (about 5.6 miles). Forecasts are made for 137 vertical levels above each of these grids, yielding a total of about 900 million cells for each processing step.5 This represents a huge improvement since 1979, when the first operational version of ECMWF's European model used grids that were 200 km apart (about 124 miles).6
Such an increase in resolution substantially increases the amount of computation required. That’s why very powerful computers are required to achieve high levels of accuracy.
Another factor affecting model accuracy is the scope and quality of the weather observations that are used to determine the current state of the atmosphere — the starting point of the forecast process. Like other models, the European model sucks in an almost unimaginable amount of data from a massive network of global weather observations. ECMWF processes a firehose of about 60 million quality-controlled data points per day (about 700 data points per second, every hour of every day), obtained primarily from satellites but also from land-based sources and from aircraft.7
All models are wrong
It's been said that, "All models are wrong, but some are useful." That is to say, models are approximations of reality — they contain error. Weather models have two major sources of error.
The first is that the models' equations are approximations that "do not perfectly replicate all of the natural processes at work in the atmosphere."8 The second source of error is the incompleteness of the observational data used to initialize the model. Small geographic variations are missed or smoothed over because weather observations aren't dense enough to capture them. Sometimes entire features, like isolated thunderstorms, are missed because they are relatively small.
Because both the model's starting data and its equations are approximations of the real world, the forecast will be inexact. And because the output of one hour's forecast is the input to the next forecast, these errors get compounded across the forecast period. As a result, small errors towards the beginning of the forecast period get larger the farther out we're forecasting.
Models that predict a single outcome, for example that it will be 57 degrees at my house in five days, are called "deterministic models". "[T]he deterministic forecast is only one possible future outcome of an infinite number of possibilities".9 Even though I know the forecast is inexact, the deterministic model tells me nothing about how inexact it is or the likelihood that it will actually be 57 degrees, instead of 56, or 75, or some other temperature. Therefore, I don’t know how much confidence I should place in the deterministic model’s forecast.
Making spaghetti
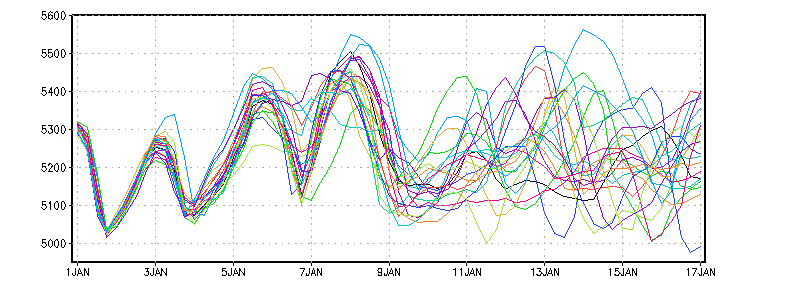
To remedy this problem, modelers began producing ensemble forecasts in the 1990s. Ensemble forecasts are an assembly of deterministic model forecasts, usually at somewhat lower resolution so the processing can be completed faster. An ECMWF ensemble, for example, consists of 51 lower-resolution model runs. For each member’s model run, the software adds a slight amount of random variability to the data representing the atmosphere’s initial conditions thereby producing a range of slightly different forecasts instead of just one.
The graph above show a "spaghetti plot" depicting an ensemble forecast of a key meteorological variable over a 17-day forecast period. Each colored line in the plot represent the forecast for an individual member of this ensemble. The members' forecasts tend to be quite similar towards the beginning of the forecast, getting increasingly divergent as the length of the forecast interval increases.
At each point in the forecast period, forecasters construct a probability distribution based on the predicted values. They use the average to represent the most likely outcome, and the variability of the forecasts to quantify the amount of uncertainty. This has proved to be a major advance, allowing forecasters to objectively assess how confident they should be in a given forecast.
Accuracy matters
One of the awesome aspects of weather forecasting is its transparency. Several times a day, forecasting systems predict values (temperature, humidity, air pressure, etc.) in the coming hours or days which can be compared against the values that actually occur, allowing an ongoing evaluation of model performance. ECMWF, for example, maintains an extensive series of such comparison data (viewable here).
I made the statement above that the European model is considered the most accurate in the world. Here's an example analysis that compares the accuracy of the European model (ECMWF 12), the UK's Met Office model (MetOffice 12), and one of the American models (NCEP 12) in predicting a key meteorological variable: 500 hPa height (a variable related to the air pressure at about 18,000 feet which is important in the development and movement of weather systems). The vertical scale is a measure of forecast error (lower values are better), and the horizontal scale represents the length of the forecast period. The data are for the three months from September through November, 2024.
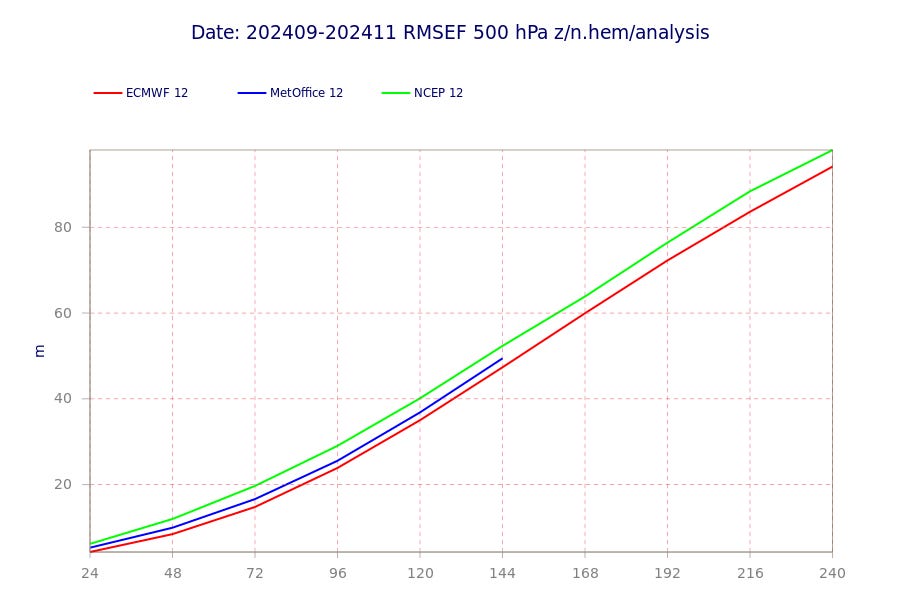
You can see that for all three models, the amount of forecast error is lower at shorter intervals than at longer intervals, as you would expect. However, at every point in the forecast period, the European model (the red line) has less forecast error. The ECMWF is the winner in most such comparisons, which is why it's considered the best model in the world.
I also made the claim earlier that there's been a dramatic increase in forecast accuracy over past decades. Let's take a look at the ECMWF's historical forecast accuracy.
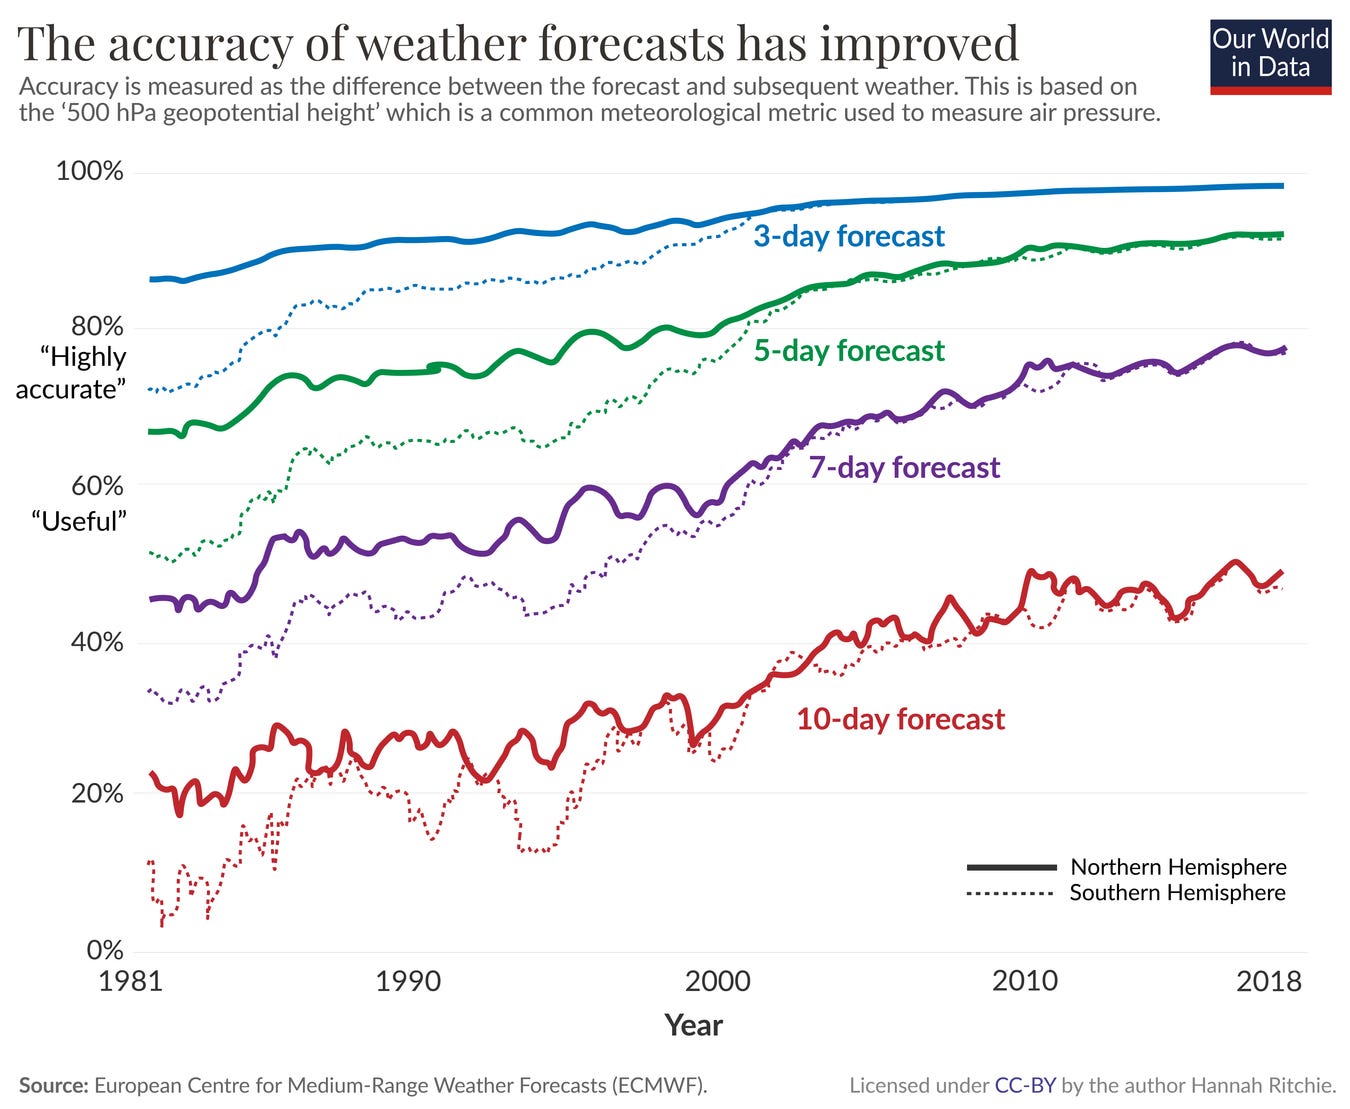
The weather parameter examined in this graph is once again 500 hPa height. The measure of accuracy on the vertical axis is different from the previous graph. In this graph, accuracy is expressed as a percentage, with 100% being perfect accuracy and 0% being no accuracy (therefore, higher values are better).
The solid lines show accuracy for northern hemisphere forecasts while the dotted lines show southern hemisphere accuracy. In the early years, forecasts for the southern hemisphere were less accurate primarily due to poorer satellite coverage. Since this disparity has been remedied,10 we can therefore focus on the solid lines for the northern hemisphere.
You can see that 3-day forecasts today are very accurate, getting quite close to the 100% mark. 5-day forecasts have exceeded the 80% ("highly accurate") benchmark since around 2000 and are now as accurate as a 3-day forecast in the 1990s. 7-day forecasts are approaching the "highly useful" standard, and are superior to 3-day forecasts made around 1990. Even 10-day forecasts have doubled in accuracy over the time period examined.
Let's look at a different type of accuracy: the ability of weather models to predict hurricane tracks. The following graph shows track error, in nautical miles, for predictions made by the US National Hurricane Center. The horizontal axis shows the forecast period, and the colored lines represent track errors for forecasts made in each decade from the 1960s through the 2020s.
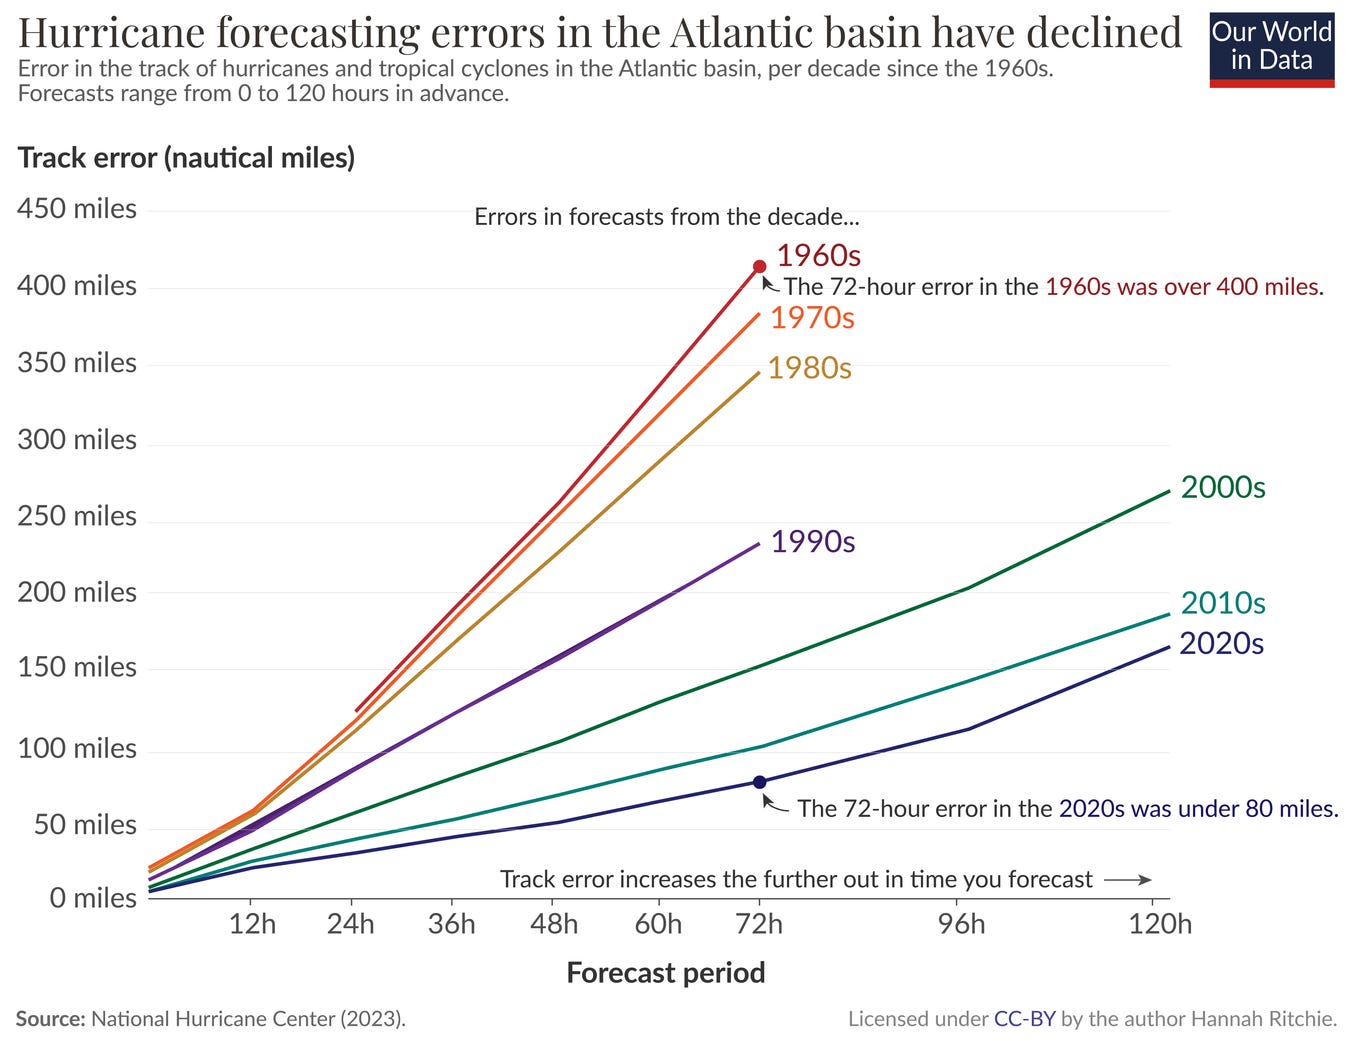
Track error is smaller for shorter forecast periods, but accuracy has continuously improved for every forecast period, with larger improvements for longer periods. For example, 12-hour forecasts today have a track error of about 20 nautical miles, compared with about 60 miles in the 1970s and 1980s. For 72-hour (3-day) forecasts, the track error is under 80 miles, about 20% of the 400+ mile error in the 1960s, a huge decline. Accuracy was so low in the 1960s that when a hurricane was three days away, forecasters could provide a landfall target that was no smaller than the entire Atlantic coast of Florida. With today's weather models, three day landfall warnings can confidently be provided to a much narrower 80-mile stretch of the coast — a huge improvement.
Maybe we've been on the wrong track
Everything I've said so far pertains to numeric weather prediction — the use of models based on equations that describe changes in the atmosphere. In the early 20th century before these methods were developed, Vilhelm Bjerknes and Lewis Fry Richardson, the visionaries described above, dismissed contemporary forecasters' reliance on matching current weather patterns with the past. They looked to the Nautical Almanac, a compendium of the position of stars and planets in the sky, as the template for how weather forecasting should work.
Bjerknes had contrasted the precision of astronomical prediction with the ‘radically inexact’ methods of weather forecasting. Richardson returned to this theme: — the Nautical Almanac, that marvel of accurate forecasting, is not based on the principle that astronomical history repeats itself in the aggregate. It would be safe to say that a particular disposition of stars, planets and satellites never occurs twice. Why then should we expect a present weather map to be exactly represented in a catalogue of past weather?11
But what if Richardson was wrong? On the face of it, the weather we experience seems to have repeating patterns. What if patterns in historical weather data could guide us in forecasting tomorrow's weather? What if meteorology took a wrong turn, opting to use equations rather than patterns to predict the weather? Could past data be somehow exploited to identify patterns and make forecasts?12
In just the last few years, we have received an answer.
Big Tech companies including Google, Microsoft, Nvidia and China-based Huawei have made rapid advances in AI weather modeling in the past two years. All four companies have published academic articles claiming their global AI models perform at least as well as the European model. Those claims were recently corroborated by scientists at the ECMWF.13
Just as numeric weather prediction had to wait for the development of computers to be feasible, perhaps the pattern-matching approach had to wait for the development of artificial intelligence (AI), a technology that is adept at extracting patterns from huge repositories of data.
AI, or machine learning (ML), models for weather forecasting are developing very rapidly. In fact, just a week or so ago as I was working on this article, Google unveiled an entirely new ensemble model, GenCast14, only a year after announcing their deterministic model, GraphCast15. The paper's lead author said, “I’m a little bit reluctant to say it, but it’s like we’ve made decades worth of improvements in one year....We’re seeing really, really rapid progress.”16
Google's GraphCast and GenCast models know nothing about physics; they contain none of the equations that are the heart of NWP models. They were trained on 40 years of global weather data ending in 2017 (for GraphCast) and 2018 (for GenCast), and then tested on subsequent years' data. Their forecasts are based solely on patterns the models identified in their respective training data sets.
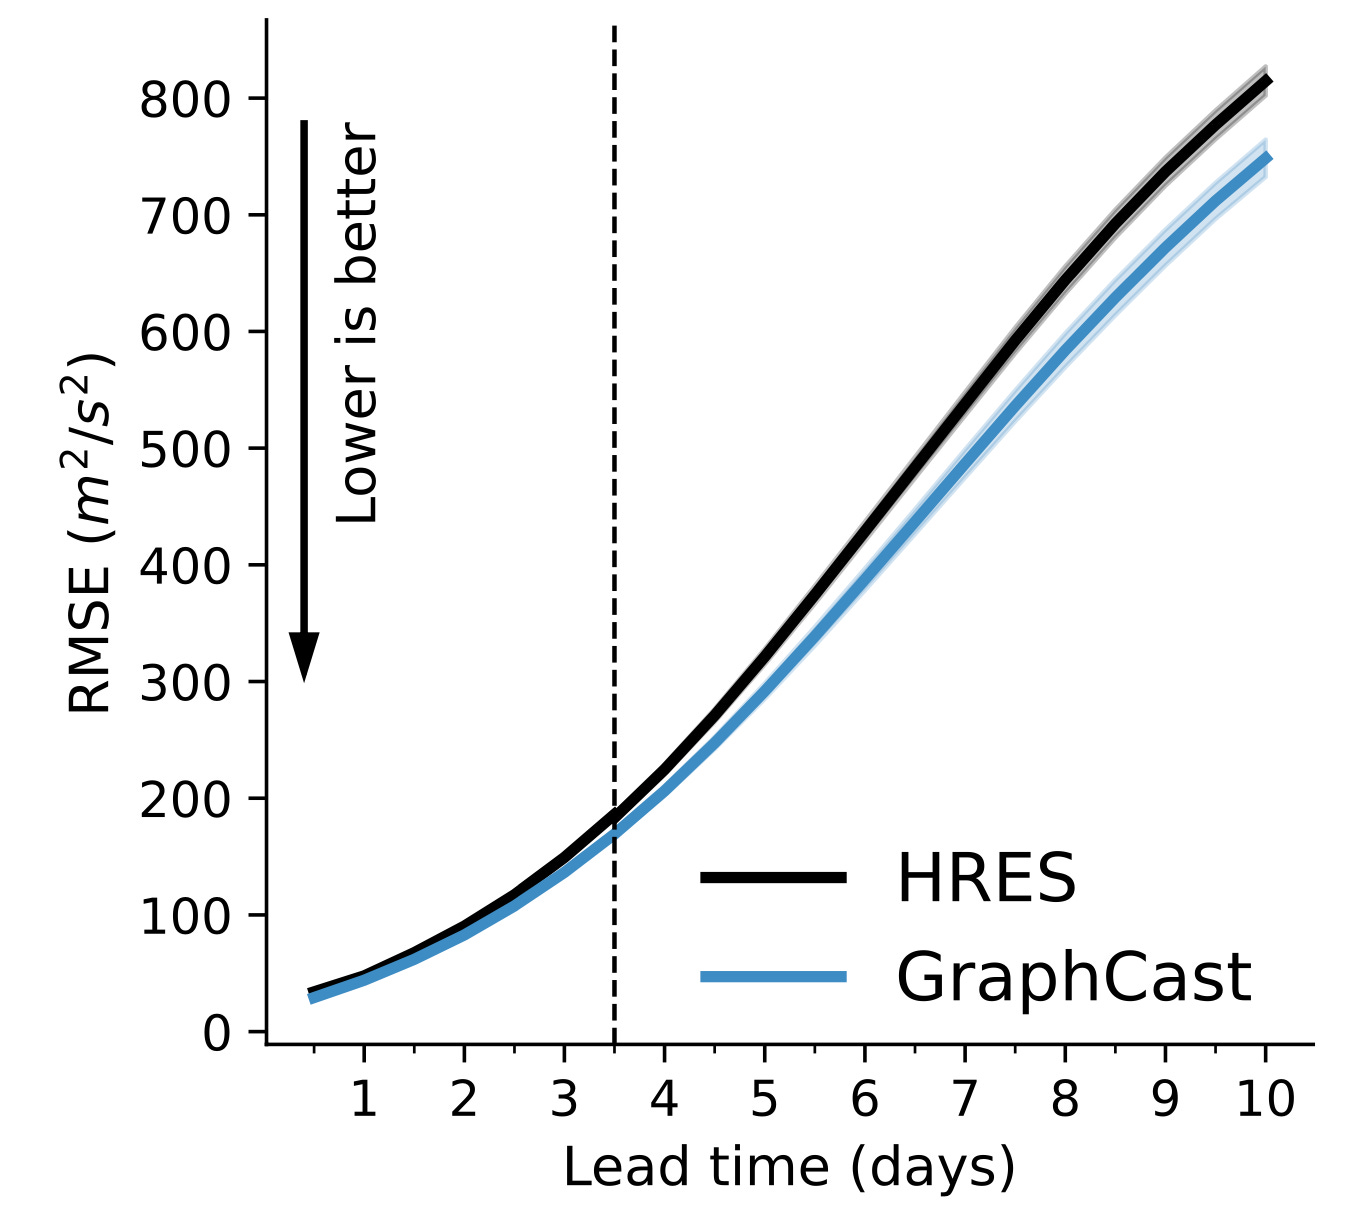
The following graph shows the accuracy of GraphCast and the European models' forecasts of that key meteorological variable we saw before: 500 hPa height. The y-axis shows a measure of the amount of error in the each forecast (lower values are better). (The vertical dashed line is irrelevant for our purposes — it represents a change after 3.5 days in the forecast period in the frequency of validation data.) You can see that for shorter time periods, GraphCast is slightly more accurate than HRES (the European model). GraphCast's edge in accuracy increases with longer forecast periods.
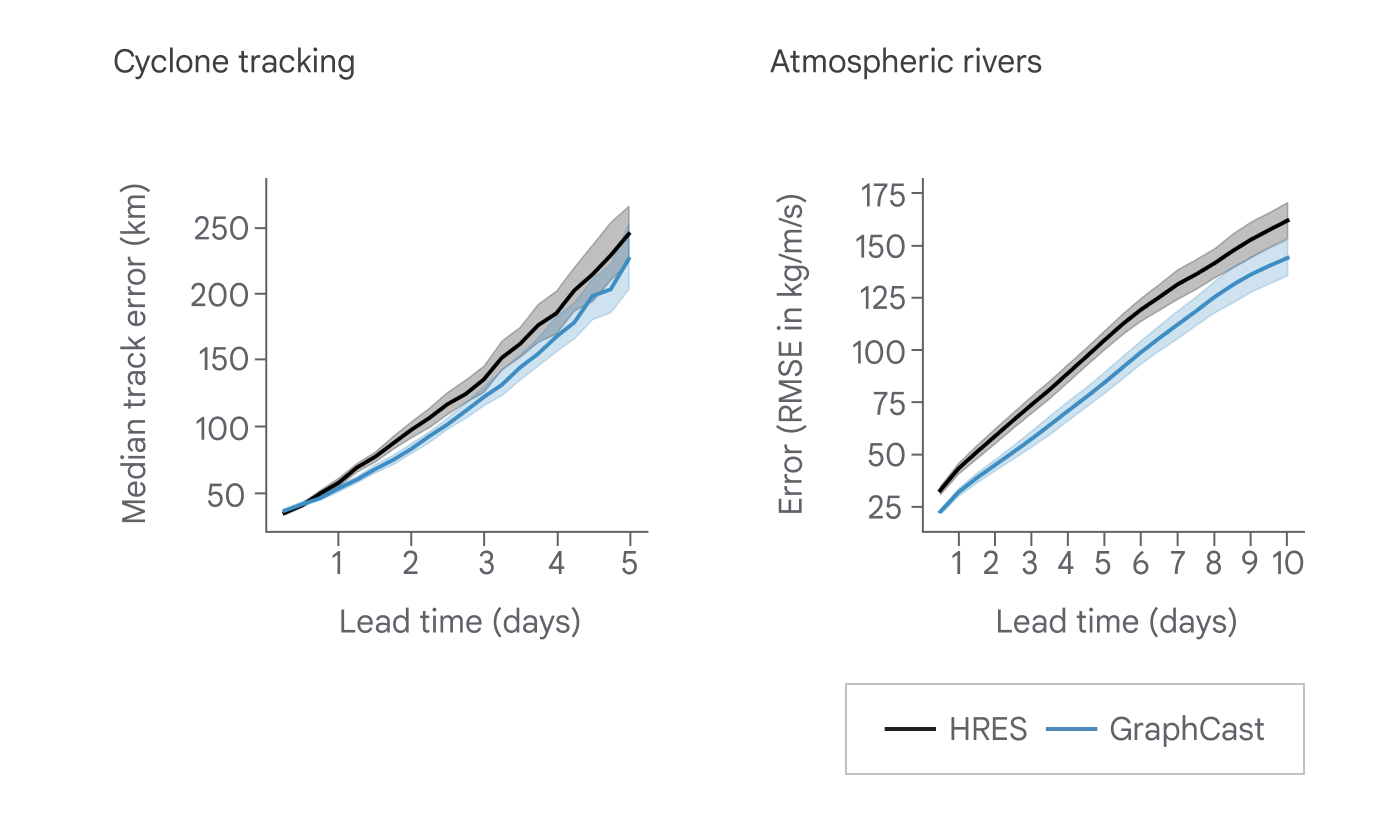
Similarly, GraphCast was better than the European model at forecasting the tracks of cyclones (hurricanes) and the strength of atmospheric rivers (narrow bands of moisture in the atmosphere that can be responsible for heavy downpours).
Overall, across forecast periods and levels of the atmosphere, GraphCast produced forecasts for 1,320 variables. It outperformed the European model on 90.3% of these target variables. GenCast did even better — it outperformed the European model on 97.2% of these variables.
As is true of most AI models, both GraphCast and GenCast consumed enormous amounts of computing resources in their training phase. But once trained, these forecast models run astoundingly fast. As noted above, the NWP models like the European models or any of the other ones run by national weather centers, perform a huge volume of calculations that require very expensive supercomputers to produce forecasts in a timely fashion. Even with the most advanced computing facilities, these models take several hours to produce a forecast.
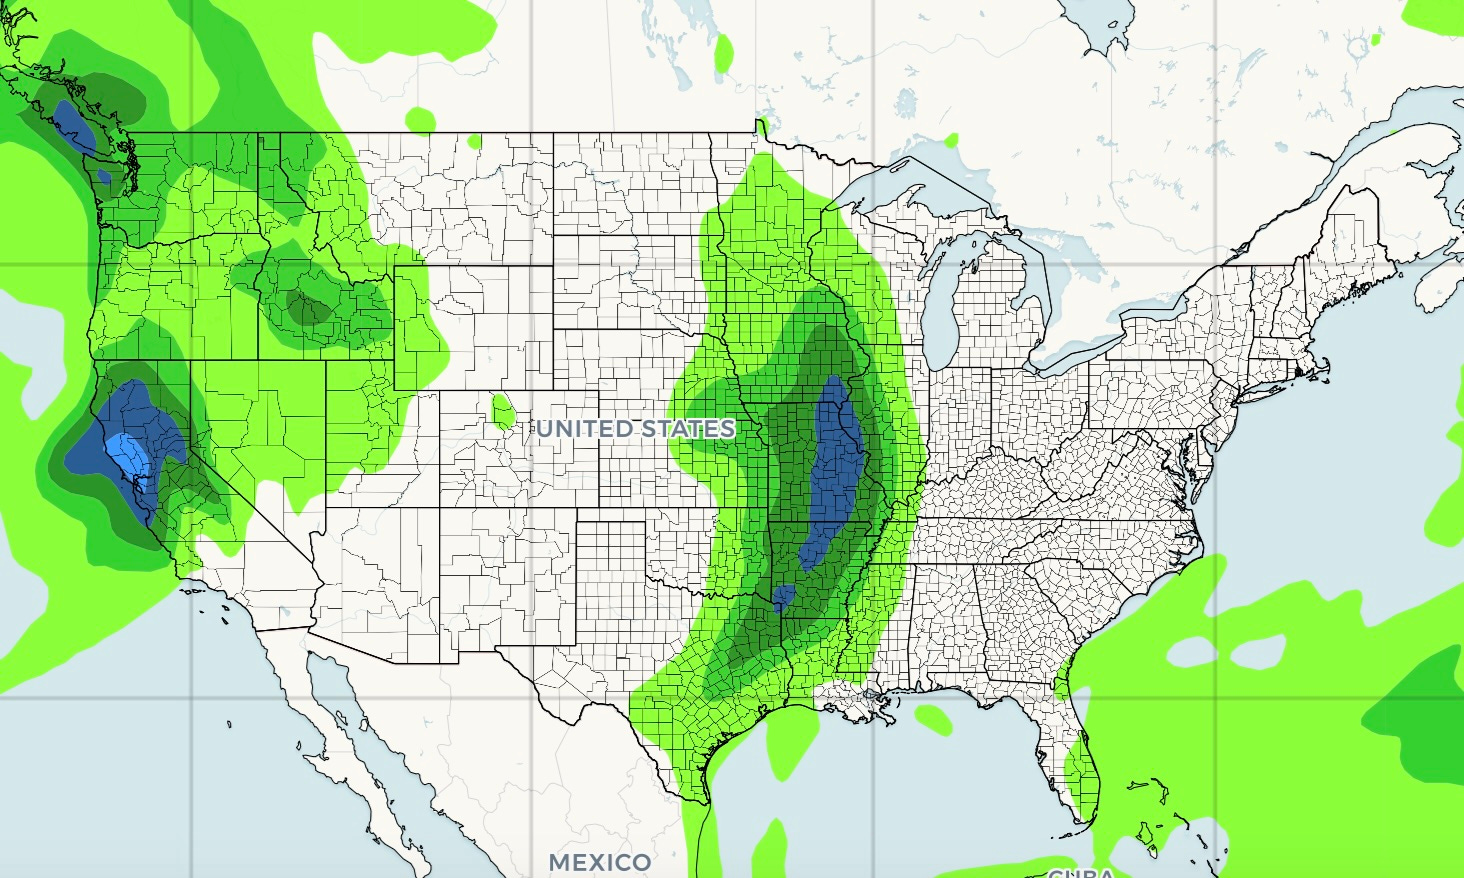
In contrast, GraphCast and GenCast can complete a forecast run in under a minute on a high-end computer. They can even be run quickly on an ordinary desktop computer or laptop. Google has made these models open-source, meaning that they are freely available to anyone who wants to download them. Just in case you have better things to do than figure out how to run an ML weather forecasting model on your personal computer, you can look at GraphCast forecasts at a website operated by Colorado State University (note that the website is not optimized for mobile devices). Here, for example, is a GraphCast precipitation map for the US that I generated at that website:
Forecasting the future of forecasting
Will ML forecast models take over the field and replace numeric forecasting models? It seems unlikely, at least for now. Everyone involved in developing these models says something like the following (from the developers of GraphCast):
Our approach should not be regarded as a replacement for traditional weather forecasting methods, which have been developed for decades, rigorously tested in many real-world contexts, and offer many features we have not yet explored,” the authors wrote. “Rather our work should be interpreted as evidence that [AI weather prediction] is able to meet the challenges of real world forecasting problems, and has potential to complement and improve the current best methods.17
Weather forecasters who work for the National Weather Service or other organizations that produce forecasts generally do not mechanically parrot the forecasts produced by a single weather model. They compare forecasts from multiple models, consider their respective strengths and weaknesses, and make allowance for local geography (such as mountains or large bodies of water) to tailor their forecasts based on their experience. ML models may just become another set of models that they consider.
The weather apps you use on your phone or computer generally use multiple models as well, although they usually do so without human intervention. Google is already incorporating "nowcast" (very short-term) ML forecasts into the information you see if you type "weather 12345" (where 12345 is your zip code) into Google's search bar.18
Though ML models will probably coexist with NWP models for the near future, we should consider the possibility that ML models will prove to be so successful that they will effectively replace numeric models farther down the road. Currently, these ML products are in their infancy. Given the recent, often startling, advancements in AI in other areas and the quick progress that has been made in ML weather forecasting in just a few years, it seems likely that these models will continue to improve. They are already marginally more accurate than their physics-based counterparts. They might get a lot better in the next few years — it's hard to know at this point.
Predicting what will happen is complicated by the fact that numeric models aren't standing still. The ECMWF is already conducting research in which the current model resolution (grids spaced at 9 km) is increased by a factor of two (to 4.5 km) or even more (to 2.8 km).19
But one aspect of ML models beats numeric models right now, hands down. That is in the efficiency with which they can be run: minutes on affordable, readily available computers compared to hours on extremely expensive supercomputers. This has big implications.
First, current NWP ensemble models typically include about 50 members, as discussed above. With ML models being so fast and cheap to run, one could envision ensembles with hundreds, or thousands, of members, making their forecast probabilities more detailed and possibly more accurate.
We can also envision organizations whose work is heavily influenced by weather conditions (e.g., agriculture, utilities, disaster relief ) running their own, tailored forecasts using inexpensive ML models. Wind farms, for example, could generate their own, localized wind forecasts and feed the results directly into software that would decide exactly when to shut down and turn on wind turbines in order to maximize efficiency.
How accurate can weather models ultimately get? Will AI models prove to be far superior to anything we have today, or will they maintain rough equivalence? Unfortunately, my Weather Watcher Certificate doesn’t qualify me to confidently make a prediction. We’ll just have to wait and see what develops.
https://www.sciencedirect.com/science/article/abs/pii/S0021999107000952?via%3Dihub
https://en.wikipedia.org/wiki/Lewis_Fry_Richardson
https://www.sciencedirect.com/science/article/abs/pii/S0021999107000952?via%3Dihub
https://www.worldclimateservice.com/2023/09/15/machine-learning-in-weather-forecasting/
https://www.ecmwf.int/en/about/media-centre/news/2016/new-forecast-model-cycle-brings-highest-ever-resolution
https://www.ecmwf.int/en/newsletter/172/editorial/towards-greater-resolution
https://www.ecmwf.int/en/research/data-assimilation/observations
https://www.worldclimateservice.com/2021/10/12/difference-between-deterministic-and-ensemble-forecasts/
https://www.worldclimateservice.com/2021/10/12/difference-between-deterministic-and-ensemble-forecasts/
https://journals.ametsoc.org/view/journals/atsc/76/4/jas-d-18-0269.1.xml
https://www.sciencedirect.com/science/article/abs/pii/S0021999107000952?via%3Dihub
I am not the first to note the connection between Richardson’s dismissal of pattern matching and the advent of AI models. See https://substack.com/@jeremycote/p-145413331, written by fellow Substack writer Jeremy Côté.
https://www.washingtonpost.com/weather/2023/11/14/weather-forecasting-artificial-intelligence-google/
https://www.nature.com/articles/s41586-024-08252-9
https://www.science.org/doi/10.1126/science.adi2336
https://www.nytimes.com/2024/12/04/science/google-ai-weather-forecast.html?smid=nytcore-ios-share&referringSource=articleShare
https://www.science.org/doi/10.1126/science.adi2336
https://support.google.com/websearch/answer/13692898
https://www.ecmwf.int/en/newsletter/172/editorial/towards-greater-resolution
Interesting article, Dave! Maybe someday the weather predictions will actually include fog instead of taunting us with clear, sunny days in the high pressure lulls between storms. This looks like a vastly better use AI than using ChatGPT to generate bar-mitzvah jokes!
You knocked my socks off once again, Dr. Dave! Now, I want to hear from you about climate change and how that might affect weather forecasting.